Seeing the Sounds of Nature

Multisensory design can enhance our digital experiences and bring us closer to the natural world. 

Image Credit: © Adobe Stock Tony Campbell/7984914

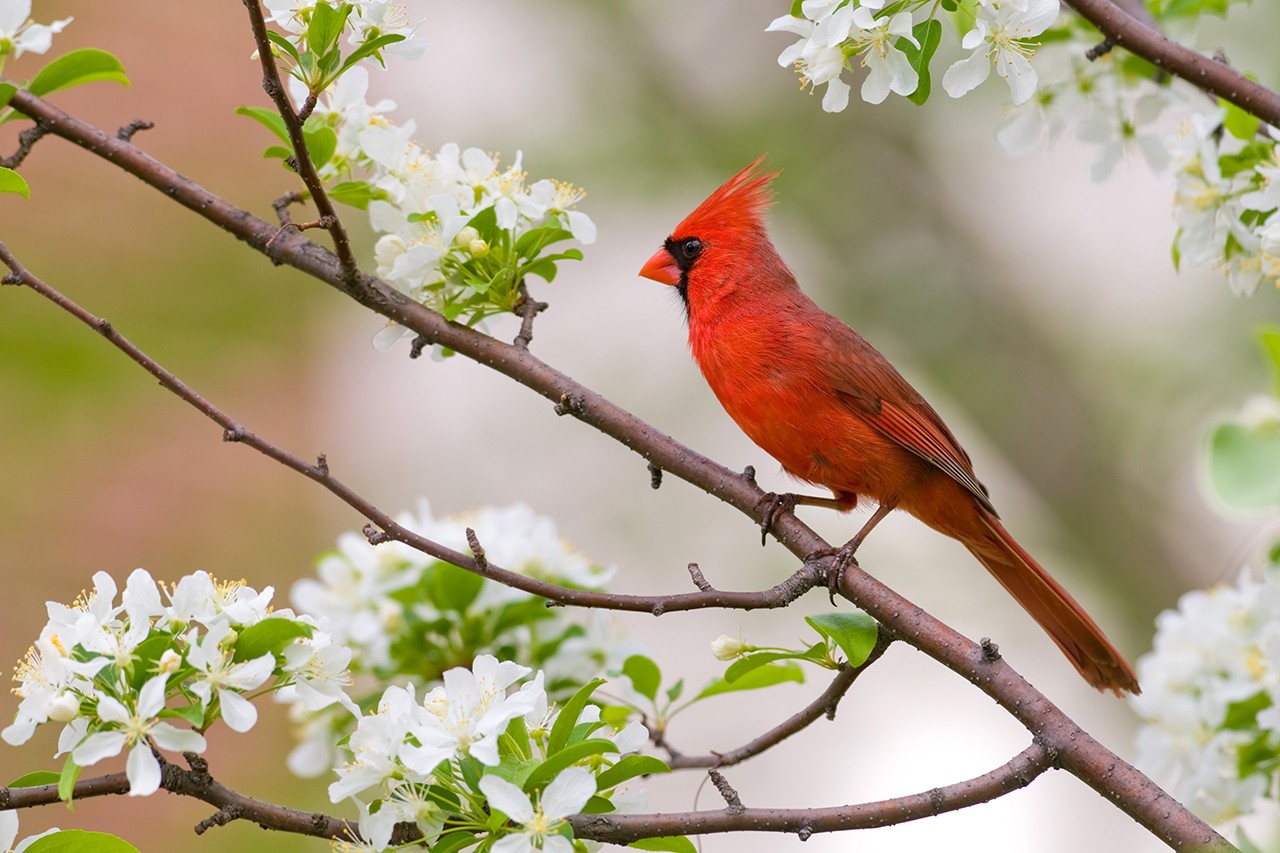
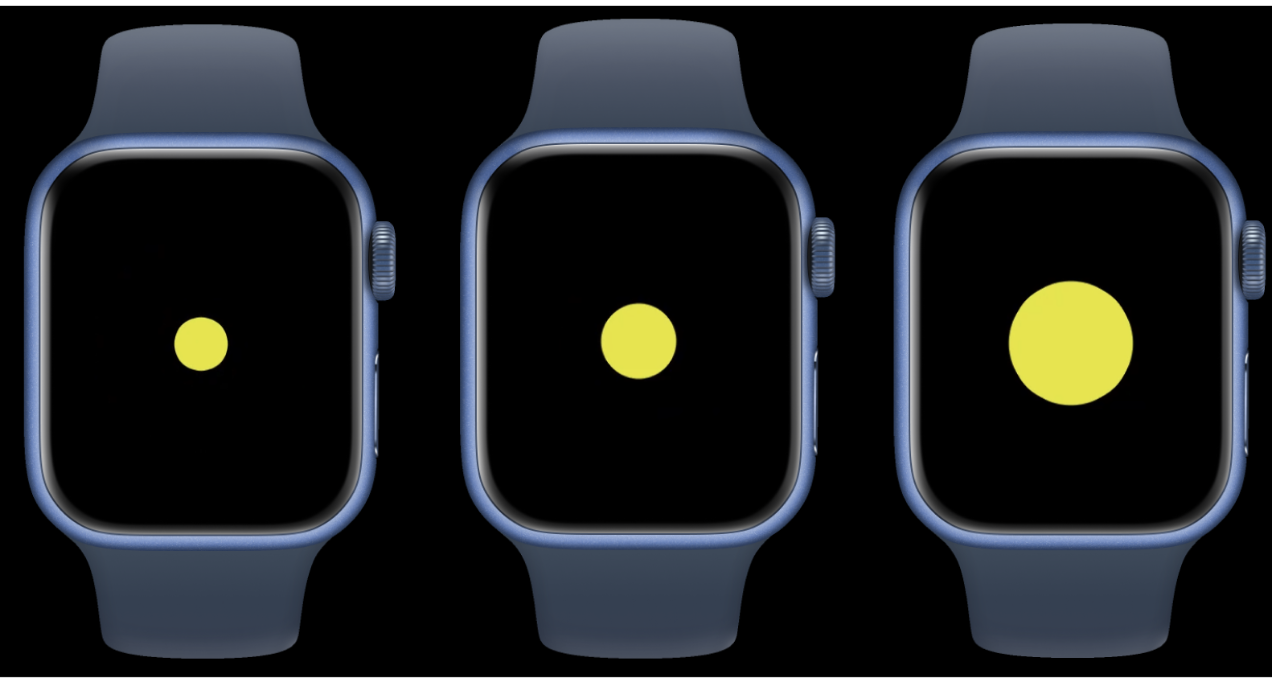
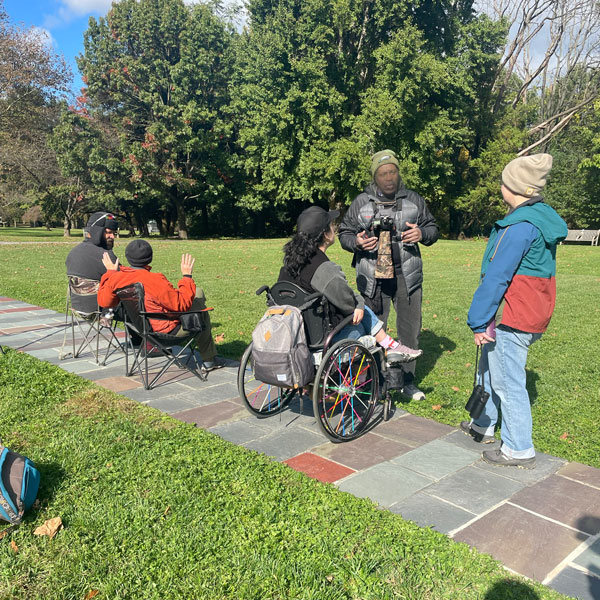
It’s a beautiful summer morning and Renee Walker sits in a park, looking at her phone. An image of concentric circles appears on her screen – orange, grey, and brown bands that seem to be constricting and expanding in time with some unknown rhythm. At first glance, it may seem like Walker is playing some type of game, like many of us who become engrossed in the digital world on our smartphones. But in fact, Walker’s screen is bringing her closer to her surroundings – the radiating circles are visual representations of bird songs, and the rhythm and colors tell her what bird it is. Walker’s screen, rather than a barrier, is a portal to nature.

As a visual communication and information designer at Thomas Jefferson University, Renee Walker, MFA teaches and studies how to represent data and information in emotionally engaging and easily understandable ways. And while the field is advancing at a rapid pace, Walker worries about the demands on our visual energy.

“As our eyes grow weary and our backs are bowed from the near-constant interactions with our beloved screens, how can we encourage the next generation of designers to enhance our sensory experiences rather than deplete them?”

To answer this question, Walker’s research and teaching have shifted to making digital experiences and communication design more multisensory – this means incorporating sound, vision and even touch in designs. “Designing for a range of sensory experiences allows people to tap into senses they might overlook,” she says. “And that enables us to deepen our awareness of our surroundings and nature.”

Walker saw an opportunity to use technologies and sensory data found in our daily lives as vehicles for multisensory design. Strolling around one day last fall, she observed the sounds around her: the cars from the freeway, the airplanes overhead. Then as she entered a park, she found herself amidst a cacophony of chirping birds and it struck her – what if there was a way to visualize bird songs?

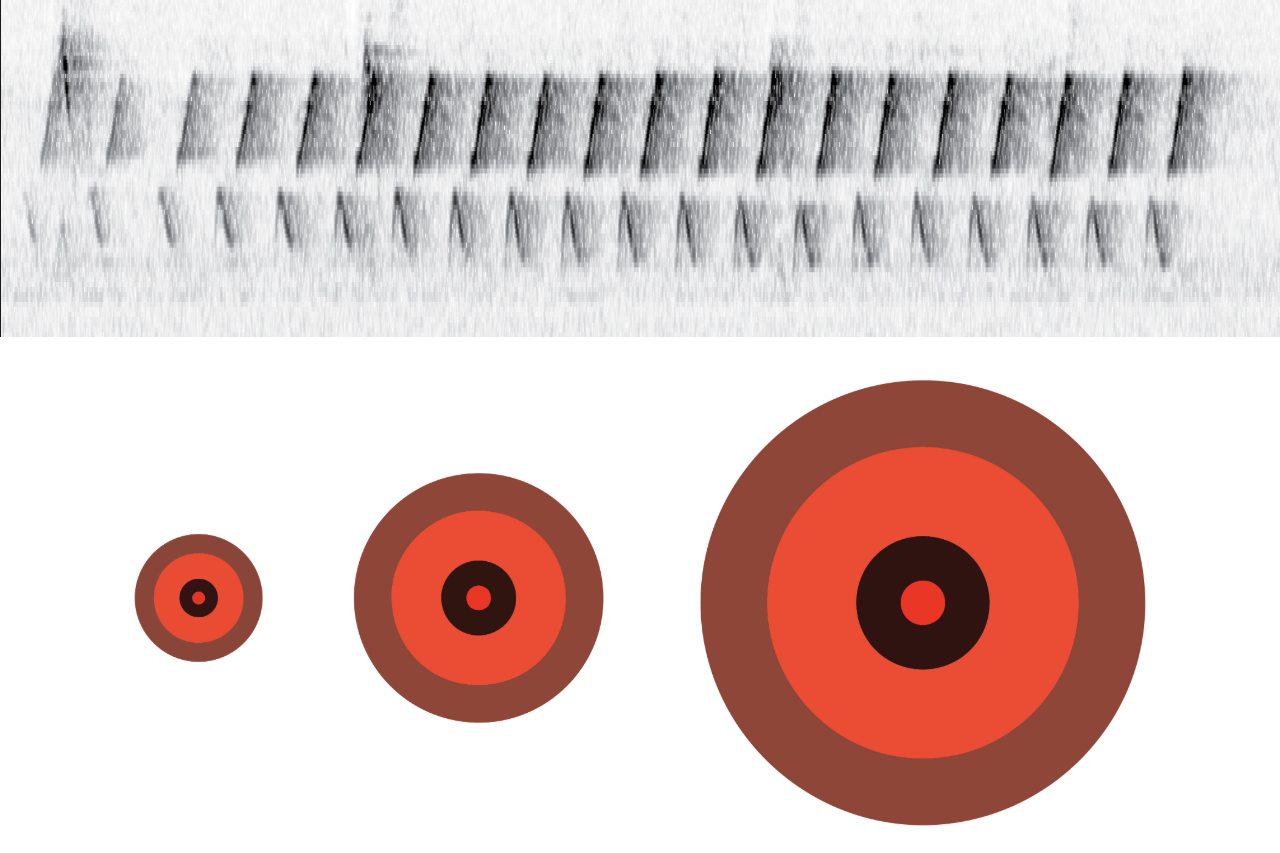
She took out her phone and began recording the different bird songs she heard. “I came home and sat down in front of my computer and thought ‘Ok, what can I do with these bird sounds?’” Auditory data like bird songs can be represented visually by a spectrogram, a computer-generated graph that shows how a sound changes in frequency and loudness over time. She wanted to create a visual that was less technical. 

(Top) Spectrogram view of the cardinal song. (Below) Stills from the time-based visual of the cardinal song.

She first translated the auditory data using coding software that linked visual elements to specific properties of the spectrogram, like the decibels or frequency. Using this code and her knowledge of how people relate to and retain visual information, she created a simple visualization: a time-based animation that radiates bursts of circles scaled to the decibel levels of the sounds, and colored based on the colors of the bird species. This fluttery graphic mimicked the sound of the bird making the song. 

Video: Time-based visualization of cardinal song

With this method in place, Walker recruited two research assistants to expand the work – Annika Zitto, a junior in the visual communication design program and Sarah Stern, a master’s student in the health communication design program (both have since graduated). Annika, coincidentally, had spent the previous summer birding and knew the popular sites in the area where they could collect audio of various bird songs. Meanwhile, Sarah joined birding expeditions to learn more about the intricacies of bird identification. “For example, birders don’t just look at the overall colors of the bird, they look at the crown and the beak and the tail feathers,” she explains. “We needed to refine the code.” They applied a size logic, so that the inner most circle is the beak, and the outmost circle is the wing, producing a visualization that mirrored the bird’s coloring. 

Video: Visualization of the bluejay bird song.

They soon had a catalog of these animations for a number of local bird species – the next step was to explore potential applications for birders. “As an amateur birder, I noticed having both the visual and sound cues helped me recognize the bird songs more easily,” recalls Annika. This was an intentional part of Walker’s multisensory design approach. She created a prototype app for a wearable device like a smartwatch, where the user is alerted by the visualization when a bird song is detected, rather than having to click through a screen on a smartphone, as is the case with other birding apps. A gentle vibration would also accompany the visual, adding tactility to the design. Almost like a birding information system, it could be particularly useful for people who are hearing impaired and/or have limited dexterity to toggle a screen. 

Prototype of watch application display picking up bird songs in the surrounding environment.

Indeed, inclusivity and the demographics of the birding community was top of mind during Walker’s design process. A 2024 report from the Fish and Wildlife Service estimates there are more 96 million birders in the U.S. However, a study found that 39% identify as having challenges to access, due to a range of limitations including mobility, vision, hearing, and intellectual disabilities, as well as social barriers. There has been a recent movement to make birding more accessible, led by organizations like Birdability.

Walker began exploring similar local organizations and events where they could share the visualizations. She and Annika attended a “bird sit” organized by the Pennsylvania Center for Adapted Sports (PCAS).  Many of the birders they spoke to found the visualizations intuitive and were able to quickly identify the different bird species.

For Katie Samson, the founder of PCAS’ birding program, Walker’s app immediately captured her imagination. “As someone with limited mobility and hearing, I really appreciated that Renee’s app allowed for multiple ways to engage with bird identification,” she says. “And it’s playful and engaging, especially compared to reading a spectrogram.” She also believes it would level the playing field for not just critical users or those with disabilities, but for everyone. “The reality is our world is becoming more digital, so something like this helps more people contribute to the citizen science of birding.”

  • Annika Zitto collecting bird song.

    Looking forward, Walker hopes to expand her user testing and get the apps in the hands of more birders and non-birders alike. She’s also exploring other sensory modalities in her data visualization research, like different ways of reading the weather that use visuals linked to temperature rather than text or number-heavy apps.

    “Ultimately, I hope this work shows that sensory data can enrich our lives, and that digital design and tools can enable us to be more connected to each other and our surroundings.”

    Video: Visualization of red wing black bird song.